Notching Control Upgrade (Since V2.5.22 version)
Principle of notching control: Connect the output signals of the control point sensors and monitoring point sensors to the control channel and measure channel of the controller. Set the test conditions such as sine or random at the control point, and set the notching spectrum at the measurement point. In the test, when the monitoring point response did not reach the limit value, the control point input was operated according to the default reference spectrum.
When the specimen resonates, the response of the monitoring point reaches or exceeds the limit value of the notching spectrum, the monitoring points will run with the notching spectrum as the test condition, and control the response of the monitoring point not to exceed the limit value. After the resonance, the response of the monitoring point decreases, and the control point continues to operate according to the reference spectrum.
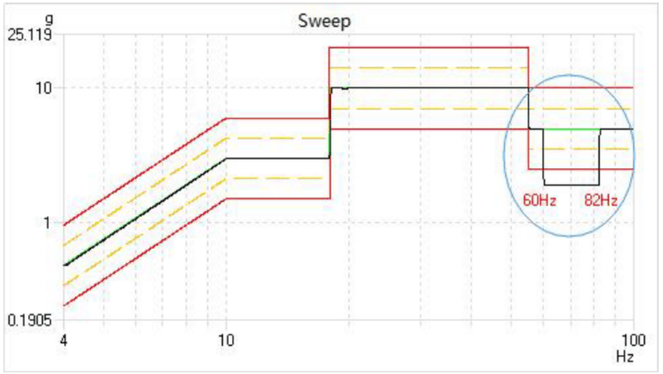
Therefore, the control channel curve of this frequency band will show a "notch" shape, so it is often called the notch control, as shown in the figure.

For Example (Sine Test): One control point, one monitoring point. From 60 to 82 Hz, the amplitude of the resonance frequency band is set to 5g.
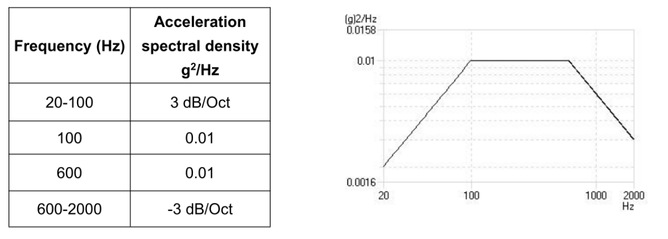
The sine sweep test conditions as below:
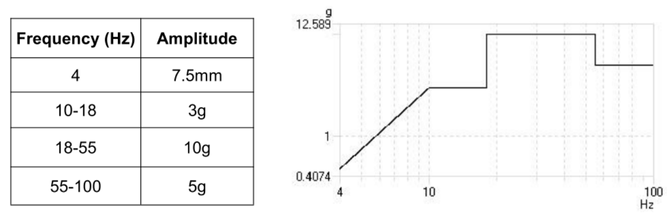
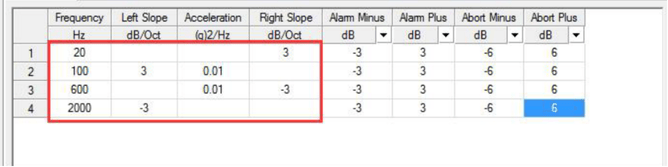
The reference Spectrum Settings are shown:
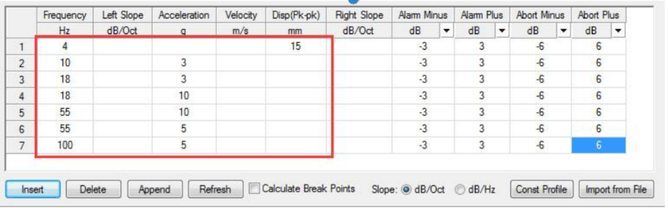
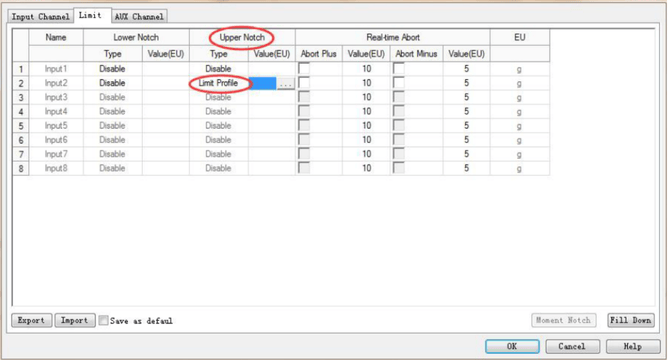
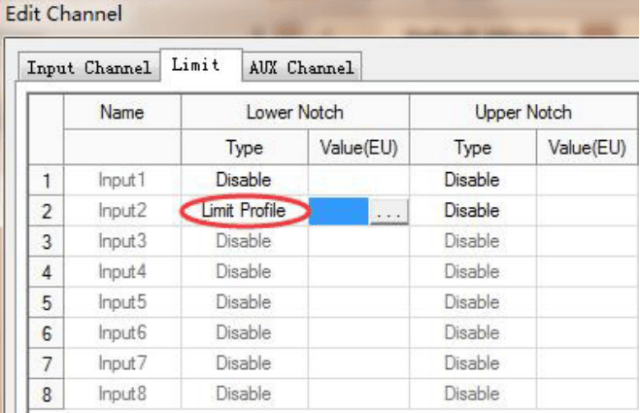
The channel edit are shown:

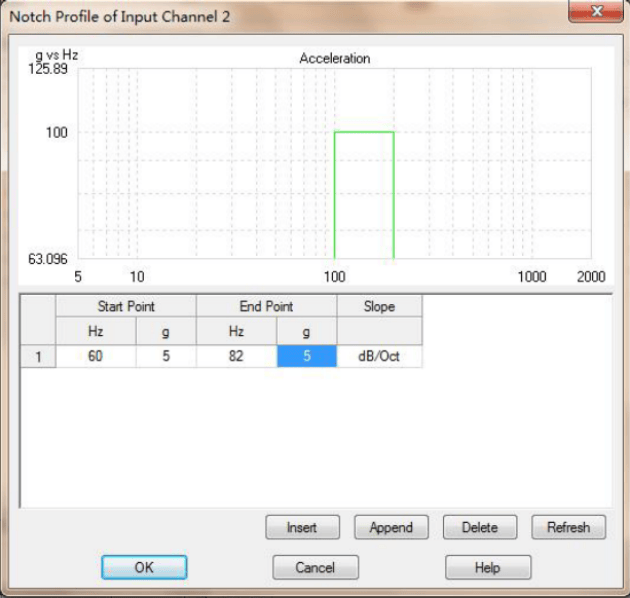
From 60 to 82 Hz, due to the resonance of the product monitoring point, the driving voltage drops to ensure that "over-test" does not occur, and the control curve will show a "Notch" shape. The test control waveform is shown in the figure:
The upper notch control method is used in the above test,it is limited amplitude control based on response point. In addition, we can also set the notch spectrum directly at the control point.
Notching Control Upgrade:
For the notching control, the new version of the software has upgraded (Since version V2.5.22). On the basis of the upper notch control, we have added the lower notch. Opposite of upper notch control, in the lower notch spectrum band, the response of the monitoring point must be greater than or equal to the lower notch spectrum.
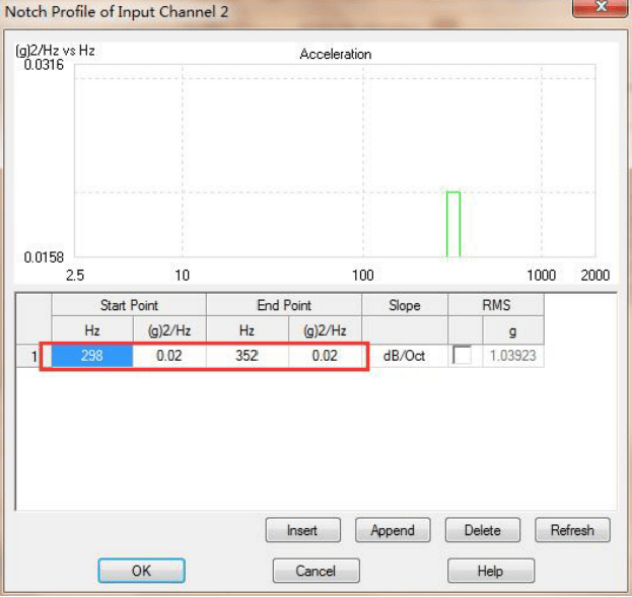
For Example (Random Test): One control point, one monitoring point, according to the analysis of structural characteristics,between 298-352Hz, the spectral density of the low groove spectrum is set to 0.02g²/Hz, and the test time is 1 hour.The test conditions as shown:
Reference spectrum settings as shown:
The notch spectrum settings are shown:
The test control waveform is shown:
