Vibration Clipping: Controlling Shaker Displacement Safely
During the low frequency large displacement random test, the software often display the displacement limit alarm, as the software will calculate the peak displacement according to the 3 times RMS displacement. But in the actual test, the peak displacement may reach 5 times or even 6 times RMS displacement. If the test condition is approached the displacement of shaker limit, the software will display the over displacement alarm during the actual test.
Generally, we use the 3sigma clipping, but this way is to clip the output voltage of the drive, the peak displacement of the shaker is not able to effectively control, the over displacement will still appear.
Vibration clipping can effectively control the displacement of shaker.
PART 1 - 3 Sigma Principe
Generally, the output random signal meet Gaussian distribution in conventional random test. The Gaussian distribution is the distribution characteristic of the random vibration signal in the amplitude domain. As show in figure 1:
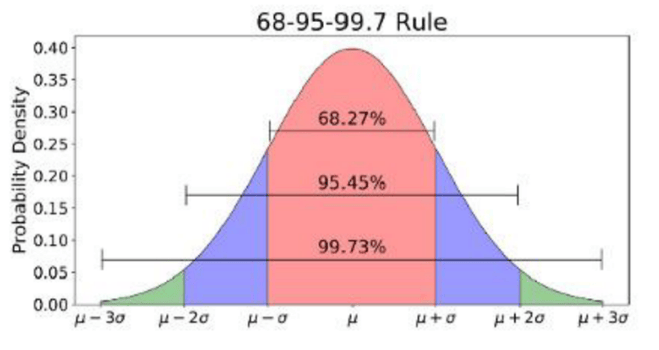
In the Gaussian distribution, σ is the standard deviation, and μ is average value. There is a 3sigma principle for random signals with Gaussian distribution. The 3sigma principle is:
The probability of the value distribution in (μ - σ,μ + σ) is 68.27%;
The probability of the value distribution in (μ - 2σ,μ + 2σ) is 95.45%;
The probability of the value distribution in (μ - 3σ,μ + 3σ) is 99.73%;
In the random test, the average value is 0, the standard deviation is the effective value, so the above principle can also be described as:
68.27% of the values are distributed within 1 times the effective value;
95.45% of the values are distributed within 2 times the effective value;
99.73% of the values are distributed within 3 times the effective value;
According to the Gaussian distribution, 99.99% of the values are distributed within 4 times the effective value;
In other words, the probability of exceeding 3 times the effective value is about 0.3%, the probability of exceeding 4 times the effective value is about 0.01%. According to the distribution of normal random signals, there will be 3 points out of the range of 3 times the effective value for every 1000 points, and 1 point is out of the range of 4 times the effective value. If the sampling rate is 512Hz, 90 points will exceed 3 times the effective value every minute, and 3 points will exceed 4 times the effective value.
For example: If the RMS displacement of low frequency large displacement random test is 7mm, The peak-to-peak displacement value calculated by 3 times the effective value is 42mm, The peak-to-peak displacement value calculated by 4 times the effective value is 56mm, but the limit displacement of shaker is 51 mm generally.
PART 2 - Application of vibration clipping and regular clipping
During the random test, there are 4-5sigma peak displacemanet (4-5 times effective value), which may damage the sensitive elements. The user can use vibration clipping to shear the acceleration, velocity and displacement to ensure that the peaks are within the limits of the shaker to protect the shaker system and test products.
Sometimes, the test conditions with large RMS acceleration value will cause the input voltage of the power amplifier to be too high and lead to alarm. For example, the output voltage of drive is 2V, the peak value will reach more than 10 V since the random drive signal may produce a peak signal of more than 5sigma (5 times the effective value). The user can use regular clipping and perform 3sigma clipping on the drive output at this point to cut off the peak signal of more than 3sigma to ensure that there is no over voltage alarm during the high level random test and ensure output power of amplifier.
PART 3 - Vibration Clipping
Regular Clipping is used to reduce extreme voltage peaks of the drive output signal, and this clipping method does not directly restrict the motion of the shaker.
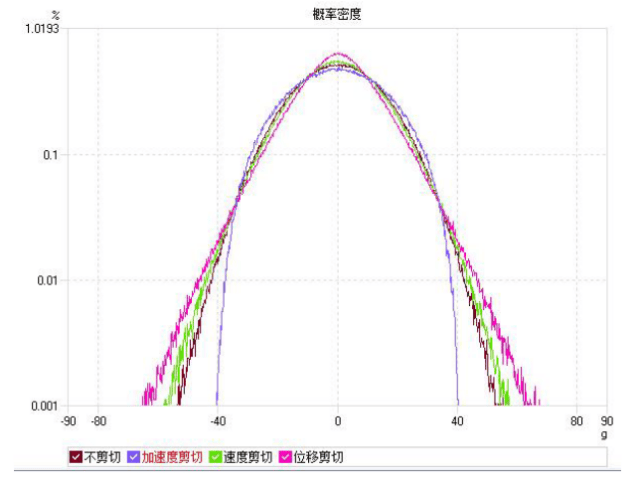
For vibration clipping, it is to reduce the extreme peaks of the response input signal. This clipping is applied to control input that do not exceed maximum acceleration, velocity, or displacement limits as much as possible. The vibration clipping can better ensure that the test is carried out within shaker limits. When the vibration clipping is applied to acceleration, velocity and displacement, the probability density distribution curve of random acceleration signal is shown in the figure:
PART 4 - Comparison between regular clipping and vibration clipping
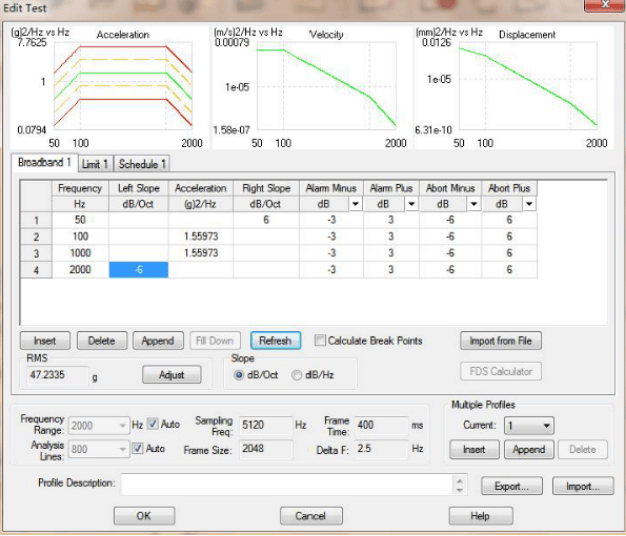
In the fields of engineering technology such as aerospace, electronics and electrical components, a large number of environmental vibrations are random vibrations. For the high level random test, it is necessary to perform 3sigma clipping on the peak acceleration to avoid the damage of products. For example, the acceleration of random test is 47.23grms (GJB360B-2009, in table 214-1), the peak acceleration needs to be clipped to within 3 times the effective value.
Profile setting:
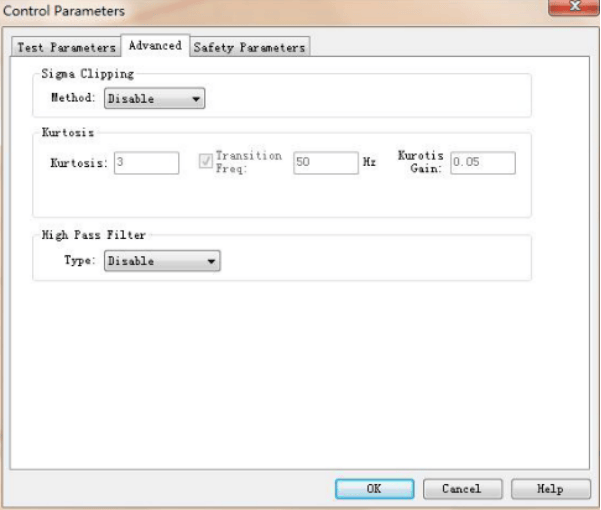
Clipping Setting:
1. 3sigma Regular Clipping:

2. 3sigma Vibration Clipping:

The following shows the time-domain recording signal:
1. 3sigma Regular Clipping:

2. 3sigma Vibration Clipping:

By comparison, it can be found that the peak acceleration signal is always in the range of 3sigma when using the vibration clipping.
Displacement Clipping Comparison
Random test:
RMS displacement: 1mm;
Pk-pk displacement: 6mm (3sigma)
Pk-pk displacement: 8-10 mm (4-5sigma)
The displacement of shaker limit is 10mm, the user need to cut the displacement to a range of 3 times the effective value to protect the small shaker.
Test spectrum is shown in figure 8:
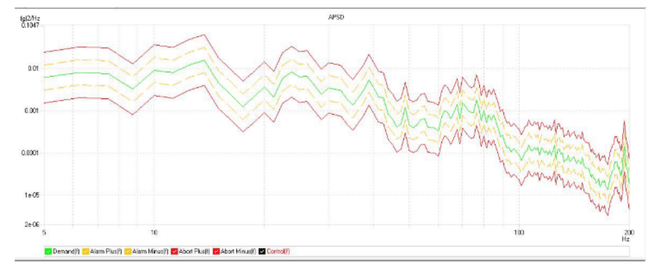
Shaker Limit:

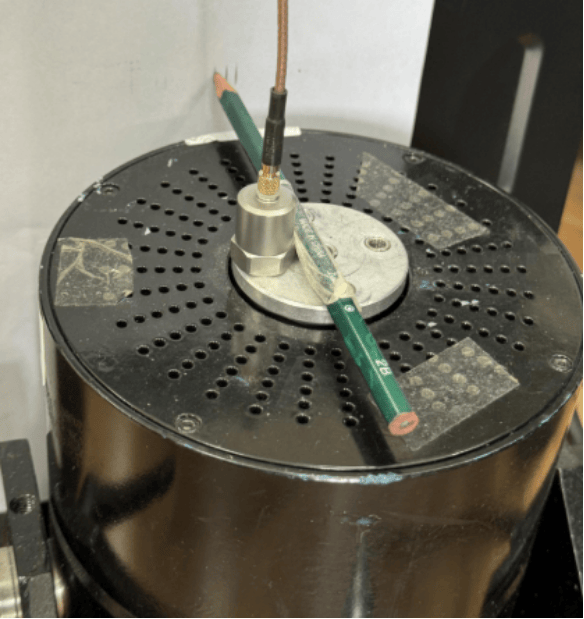
The test will be carried out in three ways: Disable, Regular and Vibration clipping. During the test, the pencil will be fixed on the table to draw the stroke on the white paper, which can more accurately measure the actual displacement of the shaker to compare the effect of regular clipping and vibration clipping.
Test installation is shown in figure 10:
Disable:
Regular Clipping:

Vibration Clipping:

There are three vertical lines from right to left, which correspond to the displacement of disable, regular clipping and vibration clipping. After measurement, the displacement stroke of the three ways is 8.5mm, 8mm, 6mm respectively.

By comparison, we can found that the effect of displacement shear is not obvious when using regular clipping. Vibration clipping can effectively control the peak displacement within the range of 3sigma.